
Reading the Improvement Board: Seeing Culture in Action
You can’t see the wind—but you can see leaves trembling, branches bending, and trees swaying in a storm.
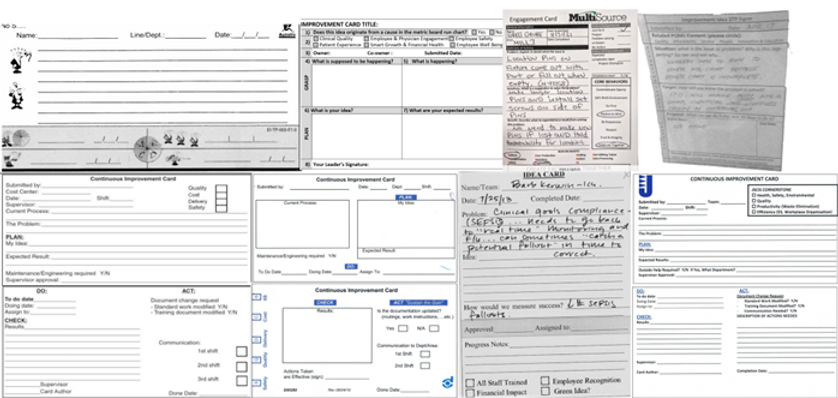
Similarly, you can’t see ideas—but you can see them on the improvement board. Each card is a signal of energy, engagement, and cultural health.
In Lean and continuous improvement (CI) environments, the improvement board is more than a tool—it’s a diagnostic instrument. A seasoned leader can stand in front of a board and, in under 60 seconds, assess the pulse of the improvement culture. Mastering this skill transforms reactive management into proactive cultural leadership.
The Metaphor That Changes Everything
Invisible forces become visible through their effects:
| Invisible Force | Visible Effect |
|---|---|
| Wind | Moving leaves, bending branches |
| Improvement Culture | Idea cards on a board |
The board does not create culture—it reflects it. Google searches for "improvement board," "idea board lean," and "kaizen board" have risen 340% in the past five years, signaling growing adoption. But adoption alone does not guarantee health. A board full of stale cards is like a forest in dead calm: something is wrong.
The Four Vital Signs of a Healthy Improvement Board
When evaluating an improvement board, focus on four key metrics: Velocity, Quality, Quantity, and Participation.
1. Velocity: How Fast Are Ideas Moving?
What to Look For:
- Age of each card: date written → date implemented
- Ideal: < 3 weeks from idea to completion
- Warning: Cards > 6 weeks
- Danger: Cards > 90 days
Why It Matters: Velocity reflects trust and responsiveness. Slow movement signals fear of failure, bureaucratic approval loops, or leadership disengagement.
Real Example: A Midwest manufacturing plant reduced average idea cycle time from 78 days to 14 days. Submission rates tripled within six months.
Actionable Tip: Track “Date Submitted” and “Date Closed” for every card and use color-coded aging indicators (green < 2 weeks, yellow 2–4, red > 4).
2. Quality: Are Ideas Solving Real Problems?
What to Look For:
- Clear Problem → Hypothesis → Expected Result
- Example: “Line 3 stops 4x/shift due to jam at station 7 → Test wider guide rail → Expect <1 stop/shift”
Red Flags:
- Vague ideas: “Improve safety.”
- No measurable outcome
- No root cause connection
Why It Matters: High-quality ideas reflect scientific thinking (PDCA) and customer focus. Low quality indicates a suggestion box rather than a continuous improvement system.
Pro Validation Framework:
| Element | Question |
|---|---|
| Problem | What gap exists? |
| Hypothesis | What do we think will fix it? |
| Experiment | How will we test it? |
| Result | How will we measure success? |
Coaching Tip: Ask submitters to clarify the problem and expected result to strengthen idea quality.
3. Quantity: How Many Ideas Per Person?
What to Look For:
-
Ideas per employee per month
Benchmark:
- <0.5: Early stage
- 0.5–1.0: Developing
- 1.0: Mature
-
2.0: World-class (e.g., Toyota)
- Why It Matters: Quantity reflects psychological safety and accessibility. Low volume = disengagement.
- Case Study: A call center increased submissions from 0.3 to 2.1 ideas/employee/month by:
- Simplifying the card format
- Celebrating all implemented ideas, not just major wins
- Responding to submissions within 24 hours
- Formula:
- Ideas per Employee per Month = Total Ideas Submitted ÷ Headcount
- Goal: >1 idea per employee per month within 12 months of launch.
4. Participation: Who Is Contributing?
- What to Look For:
- Diversity of contributors: all shifts, temporary staff, support functions
- Check handwriting and names
- Red Flags:
- 80% of cards from 2–3 people
- All cards in one person’s handwriting
- Why It Matters: Broad participation indicates ownership and inclusion. Narrow participation signals dependency on a few individuals.
- Participation Heatmap Example:
-
Department % of Staff Submitting ≥1 Idea Assembly 68% Quality 22% Maintenance 41% - Goal: >60% of employees submit ≥1 idea per quarter
- The Golden Rule: Keep Idea Cards Simple
- Complex cards reduce velocity. Over-engineered cards discourage submissions.
- Bad Card Example:
Multiple fields, approval signatures, cost/benefit analysis → 12-minute completion time → low submission
- Good Card Example:
Date, Name, Problem, Fix, Expect → 90-second completion time → 4x submission rate
- Design Principles:
- Fits on a 4x6 sticky note
- Maximum 3 fields: Problem, Fix, Expect
- Use visual indicators for status (e.g., colored dots)
- Building the System: Beyond the Board
-
System Element Purpose How to Strengthen Daily Huddles Review new ideas and assign owners 10-min stand-up at the board Leader Response Time Build trust Acknowledge within 24 hours Celebration Ritual Reinforce behavior “Idea of the Week” recognition Coaching at Gemba Develop problem-solving Ask: “What did you learn?” Metrics Dashboard Track culture health Velocity, Quality, Quantity, Participation
- Diagnosing Your Board: A 60-Second Assessment
- Ask the following:
-
Question Healthy Needs Help Are >70% of cards <3 weeks old? Yes No Do >80% have Problem → Fix → Expect? Yes No >1 idea/employee/month? Yes No Names from >50% of staff? Yes No - Scoring:
- 4 Yes = Thriving
- 2–3 Yes = Developing
- <2 Yes = At Risk
Real-World Transformations
- Automotive Tier 1 Supplier
- Before: 0.4 ideas/employee/month, 82-day cycle
- After: Simplified card, 5-min daily huddle, thank-you postcards → 1.8 ideas/month, 11-day cycle, $1.2M savings
- Hospital Nursing Unit
- Before: 3 cards/month, board ignored
- After: Nurses co-designed cards with patient impact → 2.3 ideas/nurse/month, reduced medication errors 31%
Your 30-Day Action Plan
-
Week Action 1 Audit current board: count velocity, quality, quantity, participation 2 Redesign idea card (max 3 fields, sticky-note size) 3 Launch daily 5-min huddle at board 4 Celebrate first 3 completed ideas publicly - Track weekly metrics and report to leadership to maintain accountability.
Overcoming Common Objections
-
Objection Response “People don’t have time for ideas.” They have time for problems. One idea takes ~90 seconds. “Most ideas are bad.” Volume creates quality. Coach ideas rather than criticize. “Leadership won’t support.” Start small, show measurable impact in 30 days.
Final Thought: Culture Is Visible
- You don’t need a survey to measure engagement. You need a live, updated, diverse improvement board.
- A well-maintained board is like a forest in the wind: flexible, alive, and strong. Stop managing the board. Start reading the culture.
- Your Turn: Examine your improvement board. What does it say about your culture? Track one metric, take a photo, or share a key observation—then act on it.
Comments